Background
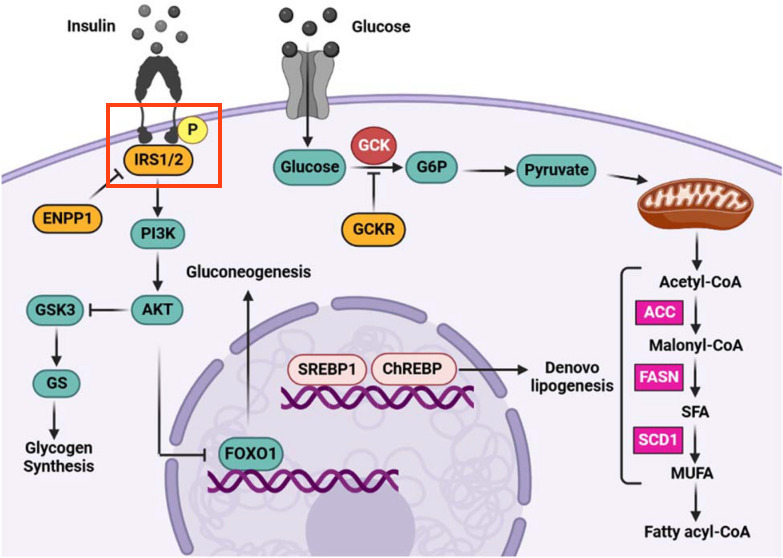
Protein phosphorylation is a common post-translational modification of proteins, which involves the addition of a phosphate group to specific amino acids of a protein by enzymes called kinases. The phosphorylation of proteins affects their activity, either activating or inactivating them, and is a common theme in signal transduction cascades. In the case of the Glucose-insulin signaling pathway, the binding of Insulin to the insulin receptor (INSR) causes conformational changes of the receptor, and autophosphorylation which activates the insulin receptor. The Insulin receptor substrate (IRS1) can then bind the insulin receptor and is subsequently phosphorylated by INSR, which activates the protein, thus transmitting the signal to downstream pathways. Although the pathway figure appears to show phosphorylation of INSR, the article text actually mentions IRS1: "Insulin controls glucose metabolism and results in glucose uptake through the phosphorylation of insulin receptor substrate....", so we will model the phosphorylation of IRS1. It is not uncommon that information in published pathway figures differ from the information in the article text, so it is important to read the article in full and cross-check all information.
WikiPathways models allow for the addition of a number of State objects to any DataNode, which can be used to depict not only phosphorylation of specific amino acid residues, but also other post-translational modifications. In addition to indicating that a protein is phosphorylated, we have developed a method for adding specific site information to states on nodes in a way that is amenable to data mapping in tools like Cytoscape. The information is added as a structured comment. The process of protein phosphorylation by a kinase can be depicted in different ways, with varying degrees of detail. We will use a simplified style to indicate the phosphorylation of IRS1 by INSR using an arrow interaction directly from the INSR to IRS1 to indicate the activation caused by the phosphorylation, and a State node added to the IRS1 node. For more detailed information on describing protein phosphorylation in pathways, see Protein Phosphorylation.
Your Mission
Model the phosphorylation of IRS1 by INSR, by adding one State node for for Tyrosine 896 and add a structured comment to the state describing the phosphorylation event:
- Start with your draft pathway from the previous step.
- Right-click on the IRS1 node and select Add State.... from the context menu.
- Select the State object and in the Properties panel, enter "P" under Text Label.
- Next, we will add a structured comment to the state, to describe the details of the phosphorylation site and to enable data mapping. The information added will be based on the PhosphoSitePlus information for Tyr896 of IRS1, following these instructions.
- Create the structured comment in a text editor or similar.
- Double-click on the State object and in the interface that opens, select the Comments tab. Enter the structured comment here.
- Move the IRS1 and IRS2 nodes under the INSR node, and create a group of INSR1/INSR2.
- Add a mim-stimulation arrow from INSR to the IRS1/IRS2 group.
- Save your work as a GPML file under File > Save As.
- Drag-and-drop the GPML file below to check if it is correct.